
Khi ứng dụng gặp sự cố trong môi trường production, thực sự chúng ta biết bao nhiêu về những gì đã xảy ra? Và quan trọng hơn, việc gỡ lỗi để sửa bug dễ dàng đến mức nào? Hãy cùng tìm hiểu việc bắt một memory dump dễ dàng đến mức nào để chúng ta có thể debug nó.
Mục lục
Tại sao cần tạo memory dump
Bạn đã từng gặp khoảnh khắc đó khi đang dùng một ứng dụng trên máy tính để bàn, bỗng nhiên nó đơ cứng, màn hình bị xám đi, và rõ ràng ứng dụng đã ngừng phản hồi. Hoặc khi bạn truy cập một trang web và chắc chắn mình đã nhấp vào liên kết đó, nhưng trình duyệt chỉ quay loading mãi.
Mặc dù nhà phát triển có thể đã thêm logging và telemetry vào ứng dụng đó và có thể lần theo các luồng thực thi từ chúng, nhưng việc thực sự hiểu trạng thái của ứng dụng lại khó hơn nhiều.
Đây là lúc một memory dump trở nên hữu ích. Memory dump có thể chụp lại trạng thái của ứng dụng, và tùy thuộc vào việc đó là dump đầy hay dump một phần, bạn có thể xem được các đối tượng trong bộ nhớ đang chờ garbage collector dọn dẹp, bao gồm cả trạng thái nằm ngoài phạm vi (out-of-scope) vẫn có thể cung cấp những hiểu biết sâu hơn về hành vi tổng thể của ứng dụng.
Với kịch bản này, chúng ta sẽ xem xét một ứng dụng đang trở nên mất phản hồi, và một thủ phạm phổ biến cho loại sự cố này chính là cách chúng ta sử dụng mã bất đồng bộ (asynchronous) và task.
Giám sát thread pool
Mẫu mà chúng ta sẽ dùng để giám sát thread pool là: định kỳ thêm một Task của chính chúng ta vào đó, quan sát xem task đó mất bao lâu để hoàn thành, và nếu nó mất nhiều hơn một ngưỡng cho phép, chúng ta sẽ biết rằng thread pool có thể đã bão hòa và nhiều khả năng đó chính là thứ chúng ta muốn chụp dump.
Chúng ta sẽ tạo một lớp ThreadPoolWatcher để bao bọc logic này:
internal class ThreadPoolWatcher(string name = "ThreadPool Watcher", int interval = 3_000)
{
    private static readonly object DumpLock = new();
    private static int dumpCount;

    private readonly Thread thread = new(() => Watcher(interval))
    {
        Name = name,
        IsBackground = true
    };

    private static void Watcher(int interval)
    {
        while (true)
        {
            Thread.Sleep(interval);

            Stopwatch stopwatch = Stopwatch.StartNew();
            Task task = Task.Run(stopwatch.Stop);

            if (!task.Wait(interval))
            {
                Console.WriteLine($"Task did not complete within {interval} ms");
            }

            if (stopwatch.ElapsedMilliseconds <= interval) continue;

            lock (DumpLock)
            {
                if (dumpCount++ > 0)
                {
                    Console.WriteLine("Dump already created for this run; skipping additional dumps.");
                    continue;
                }
            }

            // Took over the interval to complete
            Console.WriteLine($"Task took too long: {stopwatch.ElapsedMilliseconds} ms");

            string path = Path.Combine(AppContext.BaseDirectory, $"fulldump-{Environment.ProcessId}-{DateTime.Now:yyyyMMdd-HHmmss}.dmp");

            if (OperatingSystem.IsWindows())
            {
                WindowsDumper.WriteCurrentProcess(path);
            }
            else if (OperatingSystem.IsLinux())
            {
                LinuxDumper.WriteCurrentProcess(path);
            }
        }
    }

    internal void Join() => thread.Join();
    internal void Start() => thread.Start();
}
Có khá nhiều điều đang diễn ra trong đoạn mã này, vì vậy hãy cùng phân tích một chút.
Đầu tiên, chúng ta tạo một Thread mới (mà chúng ta đặt tên để có thể nhận diện nó khi debug), khi chạy sẽ liên tục gọi phương thức Watcher. Watcher dùng Thread.Sleep để tạm dừng trong khoảng thời gian được chỉ định giữa mỗi lần kiểm tra.
Khi thread thức dậy, nó thêm một task mới vào thread pool và đo xem task mất bao lâu để hoàn thành. Nếu task mất nhiều hơn ngưỡng cho phép, điều đó cho thấy thread pool có thể đã bão hòa và chúng ta có thể muốn chụp một memory dump để điều tra sâu hơn. Ngược lại, nó quay lại ngủ. Đây là một cách đơn giản để quan sát hành vi của thread pool theo thời gian thực bằng cách khai thác thời gian thực thi của task.
Đối với việc sử dụng trong môi trường production, bạn cũng nên phòng ngừa việc tạo dump lặp đi lặp lại. Các dump đầy (full dump) có thể rất lớn và có thể chứa thông tin xác thực (credentials), token, chuỗi kết nối hoặc dữ liệu nhạy cảm khác. Việc lưu trữ chúng trong một thư mục được giới hạn quyền truy cập, thêm thời gian nghỉ (cooldown), hoặc giới hạn số lượng file được tạo ra là một mẫu an toàn hơn so với việc dump sau mỗi lần thăm dò bị chậm.
Sau đó, nếu task mất nhiều hơn khoảng thời gian được chỉ định, chúng ta sẽ dump bộ nhớ của tiến trình hiện tại, sử dụng API của Windows hoặc Linux.
Tạo memory dump trên Windows
Trên Windows, để tạo memory dump của tiến trình hiện tại, chúng ta cần gọi vào một thư viện gốc (native library), dbghelp.dll, và để Windows tạo dump cho chúng ta.
[SupportedOSPlatform("windows")]
internal static class WindowsDumper
{
    [Flags]
    private enum DumpType : uint
    {
        Normal = 0x00000000,
        WithDataSegs = 0x00000001,
        WithFullMemory = 0x00000002,
        WithHandleData = 0x00000004,
        WithUnloadedModules = 0x00000020,
        WithFullMemoryInfo = 0x00000800,
        WithThreadInfo = 0x00001000,
        WithTokenInformation = 0x00040000,
    }

    [DllImport("dbghelp.dll", SetLastError = true, CharSet = CharSet.Unicode)]
    [return: MarshalAs(UnmanagedType.Bool)]
    private static extern bool MiniDumpWriteDump(
        IntPtr hProcess,
        uint processId,
        SafeHandle hFile,
        DumpType dumpType,
        IntPtr exceptionParam,
        IntPtr userStreamParam,
        IntPtr callbackParam);

    /// <summary>
    /// Writes a full memory dump of the current process.
    /// </summary>
    public static void WriteCurrentProcess(string path)
    {
        Write(Process.GetCurrentProcess(), path);
    }

    /// <summary>
    /// Writes a full memory dump of <paramref name="process"/> to <paramref name="path"/>.
    /// </summary>
    public static void Write(Process process, string path)
    {
        ArgumentNullException.ThrowIfNull(process);
        ArgumentException.ThrowIfNullOrEmpty(path);

        string? directory = Path.GetDirectoryName(Path.GetFullPath(path));
        if (!string.IsNullOrEmpty(directory))
        {
            Directory.CreateDirectory(directory);
        }

        using FileStream stream = new(path, FileMode.Create, FileAccess.ReadWrite, FileShare.None);

        // Full memory dump: entire address space (including the heap), handles, modules and thread state.
        bool success = MiniDumpWriteDump(
            process.Handle,
            (uint)process.Id,
            stream.SafeFileHandle,
            DumpType.WithFullMemory |
                DumpType.WithFullMemoryInfo |
                DumpType.WithDataSegs |
                DumpType.WithHandleData |
                DumpType.WithUnloadedModules |
                DumpType.WithThreadInfo |
                DumpType.WithTokenInformation,
            IntPtr.Zero,
            IntPtr.Zero,
            IntPtr.Zero);

        if (!success)
        {
            throw new Win32Exception(Marshal.GetLastWin32Error(), $"MiniDumpWriteDump failed for process {process.Id}.");
        }
    }
}
Đây là một lớp dump, và vì nó chỉ hoạt động trên Windows nên chúng ta đánh dấu nó bằng thuộc tính SupportedOSPlatform("windows"). Tiếp theo, có một enum định nghĩa các loại memory dump khác nhau có thể được tạo, chẳng hạn như dump đầy bộ nhớ, dump kèm dữ liệu handle, và dump kèm thông tin thread. Hàm MiniDumpWriteDump từ dbghelp.dll được nhập vào để thực sự thực hiện việc dump, và lớp này cung cấp các phương thức tiện lợi để ghi dump của tiến trình hiện tại hoặc bất kỳ tiến trình nào được chỉ định.
Đối với ví dụ này, chúng ta đang thêm mọi thứ vào memory dump được tạo, có nghĩa là nó sẽ khá lớn. Trong ví dụ của chúng ta, điều này tạo ra một dump khoảng 125 MB, mặc dù kích thước phụ thuộc vào mức sử dụng bộ nhớ của tiến trình và nội dung dump được chọn.
Tạo memory dump trên Linux
Việc tạo một memory dump tương đương trên Linux có thể khó hơn một chút vì nó sẽ phụ thuộc vào bản phân phối đang dùng, việc nó có chạy trong container hay không, và các quyền mà tiến trình đó có. Dưới đây là ví dụ về việc tạo một memory dump đầy bằng tiện ích createdump đi kèm với runtime .NET.
[SupportedOSPlatform("linux")]
internal static class LinuxDumper
{
    // Yama LSM (see /proc/sys/kernel/yama/ptrace_scope). With the default scope of 1
    // ("restricted ptrace"), a process may only be ptraced by its own descendants unless
    // it explicitly designates another process (or PR_SET_PTRACER_ANY) as an allowed
    // tracer via prctl(PR_SET_PTRACER, ...). "Yama" spelled out in ASCII.
    private const int PR_SET_PTRACER = 0x59616d61;
    private static readonly IntPtr PR_SET_PTRACER_ANY = new(-1);

    [DllImport("libc", SetLastError = true)]
    private static extern int prctl(int option, IntPtr arg2, IntPtr arg3, IntPtr arg4, IntPtr arg5);

    public static void WriteCurrentProcess(string path)
    {
        AllowAnyProcessToPtraceSelf();

        Write(Process.GetCurrentProcess(), path);
    }

    /// <summary>
    /// Best-effort: on distros using the Yama LSM (e.g. Ubuntu/Debian) with the default
    /// ptrace_scope of 1 ("restricted ptrace"), a process may only be ptraced by its own
    /// descendants - not the parent that spawned it. createdump attaches to us as our
    /// child, so we explicitly allow any process to ptrace us. This is a no-op (and
    /// harmless) on distros where Yama isn't enabled (e.g. many Fedora/RHEL setups), and
    /// is swallowed entirely if "libc" or prctl can't be resolved at all, which can happen
    /// on musl-based distros like Alpine that don't ship an unversioned libc.so.
    /// </summary>
    private static void AllowAnyProcessToPtraceSelf()
    {
        try
        {
            _ = prctl(PR_SET_PTRACER, PR_SET_PTRACER_ANY, IntPtr.Zero, IntPtr.Zero, IntPtr.Zero);
        }
        catch (Exception ex) when (ex is DllNotFoundException or EntryPointNotFoundException)
        {
            // libc/prctl isn't resolvable this way on this platform (e.g. musl/Alpine) -
            // fall through and let createdump itself report any real permission failure.
        }
    }

    public static void Write(Process process, string path)
    {
        ArgumentNullException.ThrowIfNull(process);
        ArgumentException.ThrowIfNullOrEmpty(path);

        string? directory = Path.GetDirectoryName(Path.GetFullPath(path));
        if (!string.IsNullOrEmpty(directory))
        {
            Directory.CreateDirectory(directory);
        }

        string createDumpPath = FindCreateDump();

        using Process createDump = new()
        {
            StartInfo = new ProcessStartInfo
            {
                FileName = createDumpPath,
                // --full: entire address space (analogous to MiniDumpWithFullMemory).
                // -f: explicit output path (createdump would otherwise pick its own name/location).
                ArgumentList =
                {
                    "--full",
                    "-f", path,
                    process.Id.ToString(),
                },
                UseShellExecute = false,
                RedirectStandardOutput = true,
                RedirectStandardError = true,
            },
        };

        createDump.Start();
        string stdout = createDump.StandardOutput.ReadToEnd();
        string stderr = createDump.StandardError.ReadToEnd();
        createDump.WaitForExit();

        if (createDump.ExitCode != 0)
        {
            string hint = process.Id != Environment.ProcessId
                ? " Dumping another process typically requires running as root, the " +
                  "CAP_SYS_PTRACE capability, or /proc/sys/kernel/yama/ptrace_scope set to 0."
                : " If this is a container, ensure ptrace isn't blocked by seccomp " +
                  "(add --cap-add=SYS_PTRACE) or by an SELinux/AppArmor policy.";

            throw new InvalidOperationException(
                $"createdump failed for process {process.Id} with exit code {createDump.ExitCode}.{hint}{Environment.NewLine}{stdout}{stderr}");
        }
    }

    private static string FindCreateDump()
    {
        string runtimeDirectory = RuntimeEnvironment.GetRuntimeDirectory();
        string candidate = Path.Combine(runtimeDirectory, "createdump");

        if (!File.Exists(candidate))
        {
            throw new FileNotFoundException(
                $"Could not find the 'createdump' utility next to the runtime directory '{runtimeDirectory}'.",
                candidate);
        }

        return candidate;
    }
}
Lớp này làm một vài việc额外…
Lớp này thực hiện một số việc bổ sung. Nó dùng prctl từ libc để cho phép tiến trình con createdump gắn vào tiến trình cha của nó theo chính sách restricted ptrace của Yama, và nó định vị tiện ích createdump bên cạnh thư mục runtime để có thể tạo memory dump đầy. Trong ví dụ của chúng ta, điều này tạo ra một dump khoảng 800 MB, mặc dù kích thước phụ thuộc vào mức sử dụng bộ nhớ của tiến trình và cấu hình dump.
Mô phỏng một sự cố
Bây giờ khi chúng ta đã có thể chụp memory dump của các tiến trình, hãy mô phỏng một sự cố bằng cách cố tình gây ra một vấn đề trong ứng dụng của chúng ta, mà sau đó chúng ta có thể phân tích bằng memory dump.
internal static class ApplicationRunner
{
    public static void DoLotsOfWork() => Parallel.For(0, 1000, DoSomeWork);

    private static void DoSomeWork(int i)
    {
        Console.WriteLine("Running task {0}", i);
        Thread.Sleep(10_000);
    }
}
Đoạn mã này sẽ mô phỏng việc chạy nhiều task song song, mỗi task “làm một việc gì đó” sẽ mất nhiều thời gian để hoàn thành, nhưng không có giới hạn nào về số lượng task có thể chạy trên thread pool, có khả năng làm bão hòa nó và gây ra các vấn đề về hiệu năng hoặc khiến ứng dụng có vẻ như đang treo.
Sau đó chúng ta có thể chạy ứng dụng bằng cách tạo một instance ThreadPoolWatcher, khởi động nó, và chạy tác vụ trong khi thread giám sát chuyên biệt chờ lần thăm dò tiếp theo.
var tpw = new ThreadPoolWatcher();
tpw.Start();

ApplicationRunner.DoLotsOfWork();

// The application keeps running until the process exits or the watcher is stopped.
Sau một lúc, ứng dụng của chúng ta sẽ bắt đầu mất phản hồi và tạo ra file dump.
Phân tích memory dump
Các file .dmp được tạo ra có thể được mở trong Visual Studio với chế độ debug managed, cho phép chúng ta lần theo các call stack, kiểm tra các biến có sẵn, và xem trạng thái của ứng dụng tại thời điểm dump được tạo.
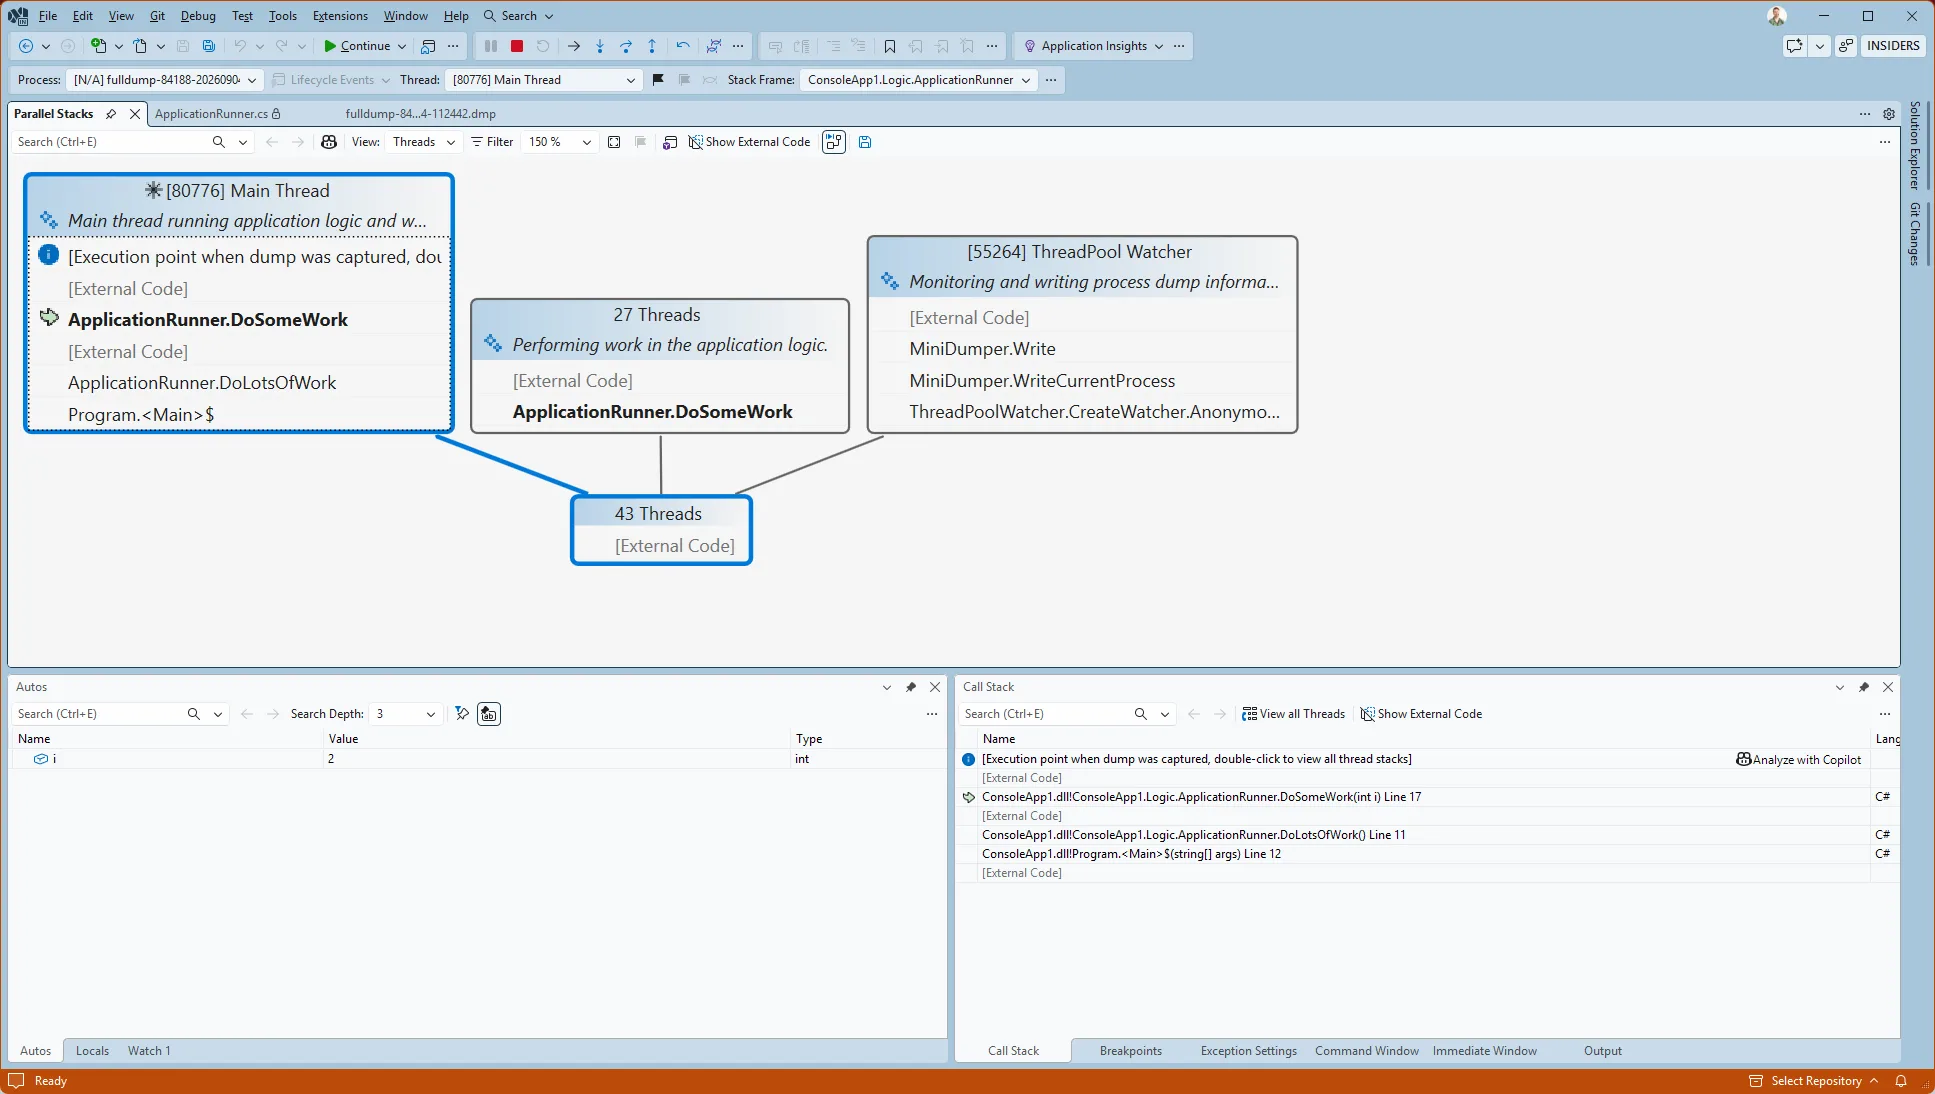
Nếu bạn muốn tìm hiểu thêm về việc phân tích memory dump và sử dụng chế độ xem parallel stacks trong Visual Studio, bạn có thể đọc bài viết kèm theo trên blog Visual Studio.
Kết luận
Trong bài viết này, chúng ta đã thấy việc để ứng dụng tự tạo memory dump khi gặp vấn đề về hiệu năng hoặc thread pool mất phản hồi dễ dàng đến mức nào, cho phép chúng ta phân tích trạng thái của ứng dụng tại thời điểm xảy ra vấn đề thay vì chỉ dựa vào logging và tái tạo lại các kịch bản. Kết hợp điều này với các công cụ phân tích memory dump của Visual Studio, chúng ta có thể thu được những hiểu biết sâu sắc về hành vi của ứng dụng và chẩn đoán, giải quyết các vấn đề phức tạp một cách hiệu quả hơn.
Bằng cách tích hợp việc tạo memory dump vào các quy trình phát triển và giám sát của chúng ta, chúng ta có thể chủ động giải quyết các nút thắt cổ chai về hiệu năng và tình trạng treo, cuối cùng dẫn đến các ứng dụng vững chắc và đáng tin cậy hơn.
Tác giả
Aaron Powell – Principal Cloud Advocate. Aaron là một Developer Advocate tại Microsoft. Với 15 năm làm phát triển web, ông đã nhìn thấy đủ mọi thứ, từ cuộc chiến trình duyệt, sự trỗi dậy của AJAX, đến sự sụp đổ của 20 framework JavaScript (và đó chỉ mới là hôm qua!). Luôn mày mò với những thứ mới, ông khám phá các ý tưởng điên rồ như tự viết một cách cài đặt số học trong .NET, tạo IoC bằng JavaScript, hay cài đặt trò chơi cờ caro bằng các commit git.
Chủ đề
- C#
- Debugging
- memory dump